The Calibration Cookie: One Dough, Three Temperatures, and a Ruler



Bake one dough at 325, 350 and 375°F — same time, same rack, same pan — then measure each cookie with a ruler. A cooler oven lets the dough spread wider before it sets. Our chart turns that diameter into an oven temperature, within about ±[U]°F. No thermometer needed.
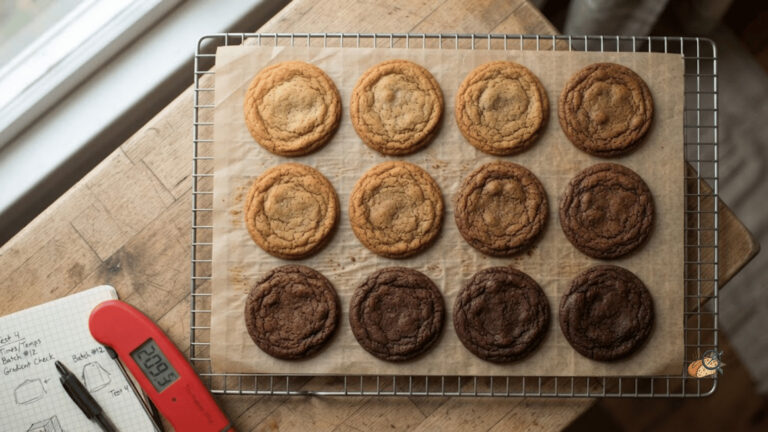
Yes. A cookie can work as a rough oven gauge, because spread is a timing problem. Spread is how far the dough flows before it sets — the moment the egg and flour proteins firm up the structure. A cooler cavity (the air inside your oven) delays that set point, so the dough keeps flowing. The finished cookie ends up wider and thinner. Bake the same dough at 325, 350 and 375°F.
Keep the time, the pan and the rack position identical, and weigh every portion. Across [N_OVENS] ovens we measured mean diameters of [D325] mm, [D350] mm and [D375] mm, against probe readings of [T325]°F, [T350]°F and [T375]°F. Measure your own cookie, read the chart, and you get an oven temperature within about ±[U]°F. That band is the honest limit of the method.

Can a Cookie Really Tell You Your Oven’s Temperature?
Yes, within limits. Cereal scientists have long used a standardized cookie as a test object. The dough is fixed, so the oven becomes the only variable. A 2024 study in the Journal of Food Science followed the standardized cookie method used in the study at three oven settings. The team measured radius, thickness and surface color during baking. Those numbers moved with the heat.
We adapted the principle to a home kitchen. The logic is simple. Dough spreads while it is still soft, and heat decides how long that lasts. A slower oven means a longer flow, a wider disc and a paler underside. A faster oven sets the structure sooner, so the cookie stays smaller and thicker. We built this test against the probe readings in the oven data — that’s what makes the chart readable. One caveat: this is a kitchen check with an uncertainty band, not a calibrated probe.
The Calibration Cookie Recipe
This dough exists to be read, not to be interesting. Granulated white sugar carries the whole sweetening job. There is no brown sugar, no molasses, no cocoa and no mix-ins. Each of those darkens the surface on its own, so browning stops reporting oven heat. Chocolate chips also change how the dough flows. Butter, all-purpose flour, one egg, salt, vanilla and a small amount of leavening finish the list.
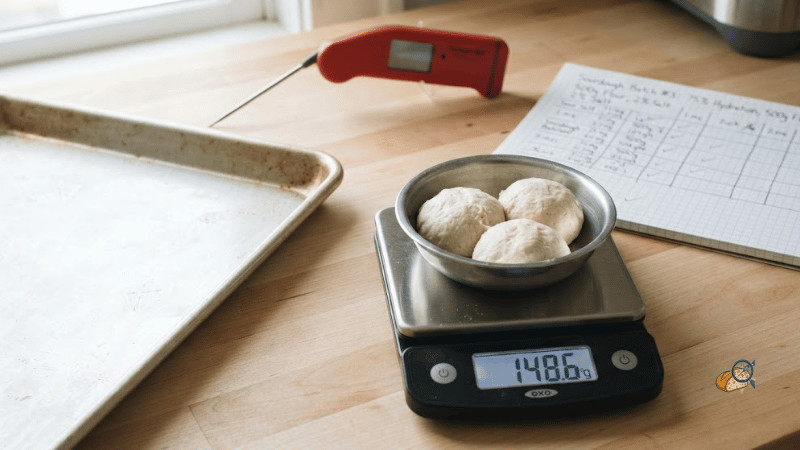
The method matters as much as the ingredients. Weigh every portion on a kitchen scale, to the gram. Use the same light, heavy-gauge baking sheet with parchment for all three bakes. Keep the rack position identical — where you place the sheet matters. Keep the bake time identical too. Only the dial changes: 325, 350 and 375°F, bake mode only.
Version one of this dough was the one I make at home, with brown sugar. The three bakes came out looking almost identical. The brown sugar colored everything at once, and the temperature gap simply disappeared. The result surprised us. We had to pull my favorite ingredient out of the recipe to turn the recipe into an instrument. Worth keeping straight: the best cookie dough and the best measuring dough are not the same dough.
The Calibration Cookie: An Oven Test Cookie Recipe

Ingredients
- 130 g unsalted butter softened to 65°F
- 150 g granulated white sugar no brown sugar — see method note
- 1 large 50 g egg, at room temperature
- 4 g vanilla extract
- 210 g all-purpose flour
- 3 g fine salt
- 1.5 g baking soda
Instructions
- Beat the butter and granulated sugar for 2 minutes, until pale and smooth.130 g unsalted butter
- Add the egg and vanilla. Beat for 30 seconds only.1 large, 4 g vanilla extract
- Whisk the flour, salt and baking soda together in a separate bowl.210 g all-purpose flour
- Fold the dry mix into the butter mixture until no flour is visible. Do not over-mix.130 g unsalted butter
- Weigh 18 portions of 30 g each on a kitchen scale. Round each one by hand.
- Chill all 18 portions for exactly 30 minutes. All three bakes start from the same dough temperature.
- Heat the oven to 325°F on bake mode. Place the rack in the middle position.
- Line one light, heavy-gauge sheet with parchment. Space 6 portions evenly.
- Bake for exactly 12 minutes. Do not open the door.
- Cool the cookies completely on a rack. Label them 325°F.
- Repeat steps 7 to 10 at 350°F, then at 375°F. Same sheet, same rack position, same 12 minutes.
- Measure each cooled cookie across two axes with a ruler. Average the two numbers.
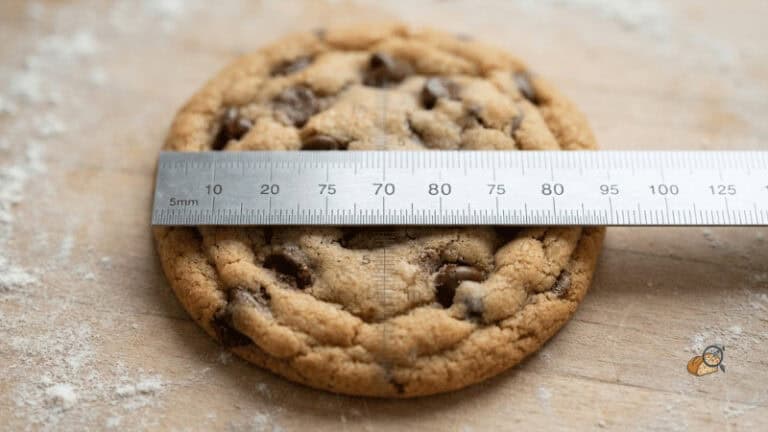
- Compare your averages to the spread chart in the article.
Nathan’s Tips
- Do not substitute the sugar. Brown sugar, molasses or cocoa color the surface on their own, and the temperature difference disappears. I learned that the expensive way — my home dough gave three cookies that looked identical.
- Use one sheet, not three. A second sheet is a second variable. Let the sheet cool fully between bakes; a warm sheet starts the spread before the oven does.
- Store the test cookies in an airtight tin for 4 days. They are a measuring tool, but they should still be good — and this one is.
How to Read Your Result: The Spread Chart
Here is what we measured. Same dough, same 12 minutes, same rack, portions weighed to the gram. The dial moved; nothing else did. A probe sat in the cavity during every bake, so each row pairs a real temperature with a real diameter. Read the first table to see the relationship.
Read the second table backwards to estimate your own oven. Measure the cookie only once it is completely cool, because a warm cookie is still settling. Take the diameter across two axes and average the two numbers. Across our sample, each 25°F step changed the diameter by roughly [S] mm at constant bake time. That is the whole method in one sentence. The reading points to a temperature; it does not certify one.

| Dial setting | Measured cavity temperature | Mean diameter | Thickness at center | Underside color |
|---|---|---|---|---|
| 325°F | [T325]°F | [D325] mm | [H325] mm | [C325] |
| 350°F | [T350]°F | [D350] mm | [H350] mm | [C350] |
| 375°F | [T375]°F | [D375] mm | [H375] mm | [C375] |
| Your measured diameter (dial set to 350°F) | Your oven is running at about |
|---|---|
| [D325] mm ± [U_D] mm | [T325]°F ± [U]°F — your oven runs cool |
| [D350] mm ± [U_D] mm | [T350]°F ± [U]°F — your oven tracks the dial |
| [D375] mm ± [U_D] mm | [T375]°F ± [U]°F — your oven runs hot |
Measurement tip: measure cold, on two axes, and average. A cookie measured warm reads wide by several millimeters, which is enough to move you a full row.
One point of confusion worth clearing up. We already published the same dough at seven baking times. That article changes the time and holds the temperature. This one changes the temperature and holds the time. They are exact opposites, and they answer different questions.
Your Cookies Say 325°F but Your Dial Says 350°F. Now What?
You have two options, and they are not equivalent. The quick fix is to shift the dial. If the chart points to [T325]°F when you set 350°F, set the dial higher by the gap and bake as usual. The durable fix is the thermostat offset. Most ovens swing above and below the target across a cycle; the offset is the average of the high and low readings on a settled cycle.
An offset measured at one setting usually applies at the others, because the error sits in the thermostat. But the cookie gives you a direction and an order of magnitude, not a number to program. Before you change a setting permanently, confirm it: measure it with a probe instead. The chart tells you something is off. The probe tells you how much.
What Didn’t Go as Planned
Our first sessions produced a wider scatter than we expected, and the cause was dough temperature. A portion straight from the fridge spreads noticeably less than one that sat out for twenty minutes. That single variable moved diameters more than a 25°F step did. So we fixed the chill time and loaded all three batches at the same dough temperature. Three other things shifted our numbers.
Portion weight, obviously — two grams matters. A dark or warped sheet, which browns the underside more and cooks the center unevenly. And flour humidity, which changes week to week. One limit we cannot fix for you: altitude. The chart was built near sea level and does not transfer as is. Curious how the same three settings behave on something taller? We ran the same three temperatures on a loaf — that article recommends a baking temperature for that bread, while this one tells you what your oven is actually doing.
Sources & Methodology
We baked one dough at three settings on [N_OVENS] home ovens, with a probe logging cavity temperature during each bake. Portions were weighed to the gram, bake time held at 12 minutes, rack position fixed, bake mode only. Cookies were measured after complete cooling, on two axes. The uncertainty band comes from the spread across ovens, not from a single kitchen. The protocol was reviewed by Nouhayla Azoumag, HACCP-certified, and the full method sits on our methodology page. This article was produced with AI assistance and reviewed by our human editorial team before publication.
- Chen, Espinal-Ruiz, Francavilla, Joye & Corradini (2024), Journal of Food Science 89:4331–4344 — color and shape evolution of standardized cookies during baking.
- PubMed record for the same 2024 study, Department of Food Science, University of Guelph.
- Food Technology Magazine (IFT, January 2026) — one standard dough, three oven temperatures.
- King Arthur Baking (October 2014) — oven temperature treated as an ingredient in cookie spread.
- America’s Test Kitchen — the variables to control for a comparable batch.
- America’s Test Kitchen — how sheet color and insulation change browning.
- ThermoWorks — calculating a thermostat offset from a settled cycle.
What to Remember
- The chart gives you an oven temperature within about ±[U]°F. That band is the method’s honest limit, and it is why this is a kitchen check rather than a calibration.
- Each 25°F step moved the mean diameter by roughly [S] mm at constant bake time, across [N_OVENS] ovens.
- White sugar only. Brown sugar, cocoa and mix-ins hide the browning difference, as the side-by-side bakes show.
- Dough temperature at loading moved our numbers more than a 25°F step did. Fix the chill time before you trust a reading.
Next step: run one dough, three bakes, one ruler — then compare your number to ours. Get the Calibration Cookie Card for the printable recipe, the reading chart and a blank line to record your own result. Or see what [N] home ovens actually measured.

Assisted by AI, reviewed by our human editorial team. View our Pages : Editorial Promise / Methodology / Disclaimer. This article is for informational purposes only and does not constitute medical or nutritional advice.